There's a 3-minute video walkthrough of the same incident at the top of the article if you'd rather watch than read.
I built a small Temporal-on-Kubernetes example to show a specific failure shape: workflows that sit in Running forever while the task queue page on the Temporal UI still looks healthy. The setup is the canonical Temporal getting-started worker (a Go worker registering a GreetingWorkflow on a task queue called greeting-queue) running as a Deployment in the same cluster as the Temporal server. Then I introduced one bad environment variable in a fresh rollout and walked the resulting incident.
The root cause is unflattering: a single env var set wrong. That is the point. Most of the incidents I have actually paged on have looked like this on the inside, and the time-to-fix has nothing to do with the difficulty of the change and everything to do with how long it takes to see across the two systems where the symptom and the cause live.
How a healthy Temporal worker registers on a task queue
The setup: a Go worker registers a GreetingWorkflow on a task queue called greeting-queue. The workflow executes a single activity, returns a result, and completes. The worker runs as a Kubernetes Deployment in the same cluster as the Temporal server, which is the shape every Temporal-on-K8s setup I have seen at customers ends up in.
When everything works, a workflow gets started on the greeting-queue task queue, the worker picks it up within milliseconds, the activity executes and returns, the workflow completes.
This is the healthy state. The worker is polling, workflows complete in under a second, and the dashboard updates in real time.
The symptom: zero pollers and timed-out workflows
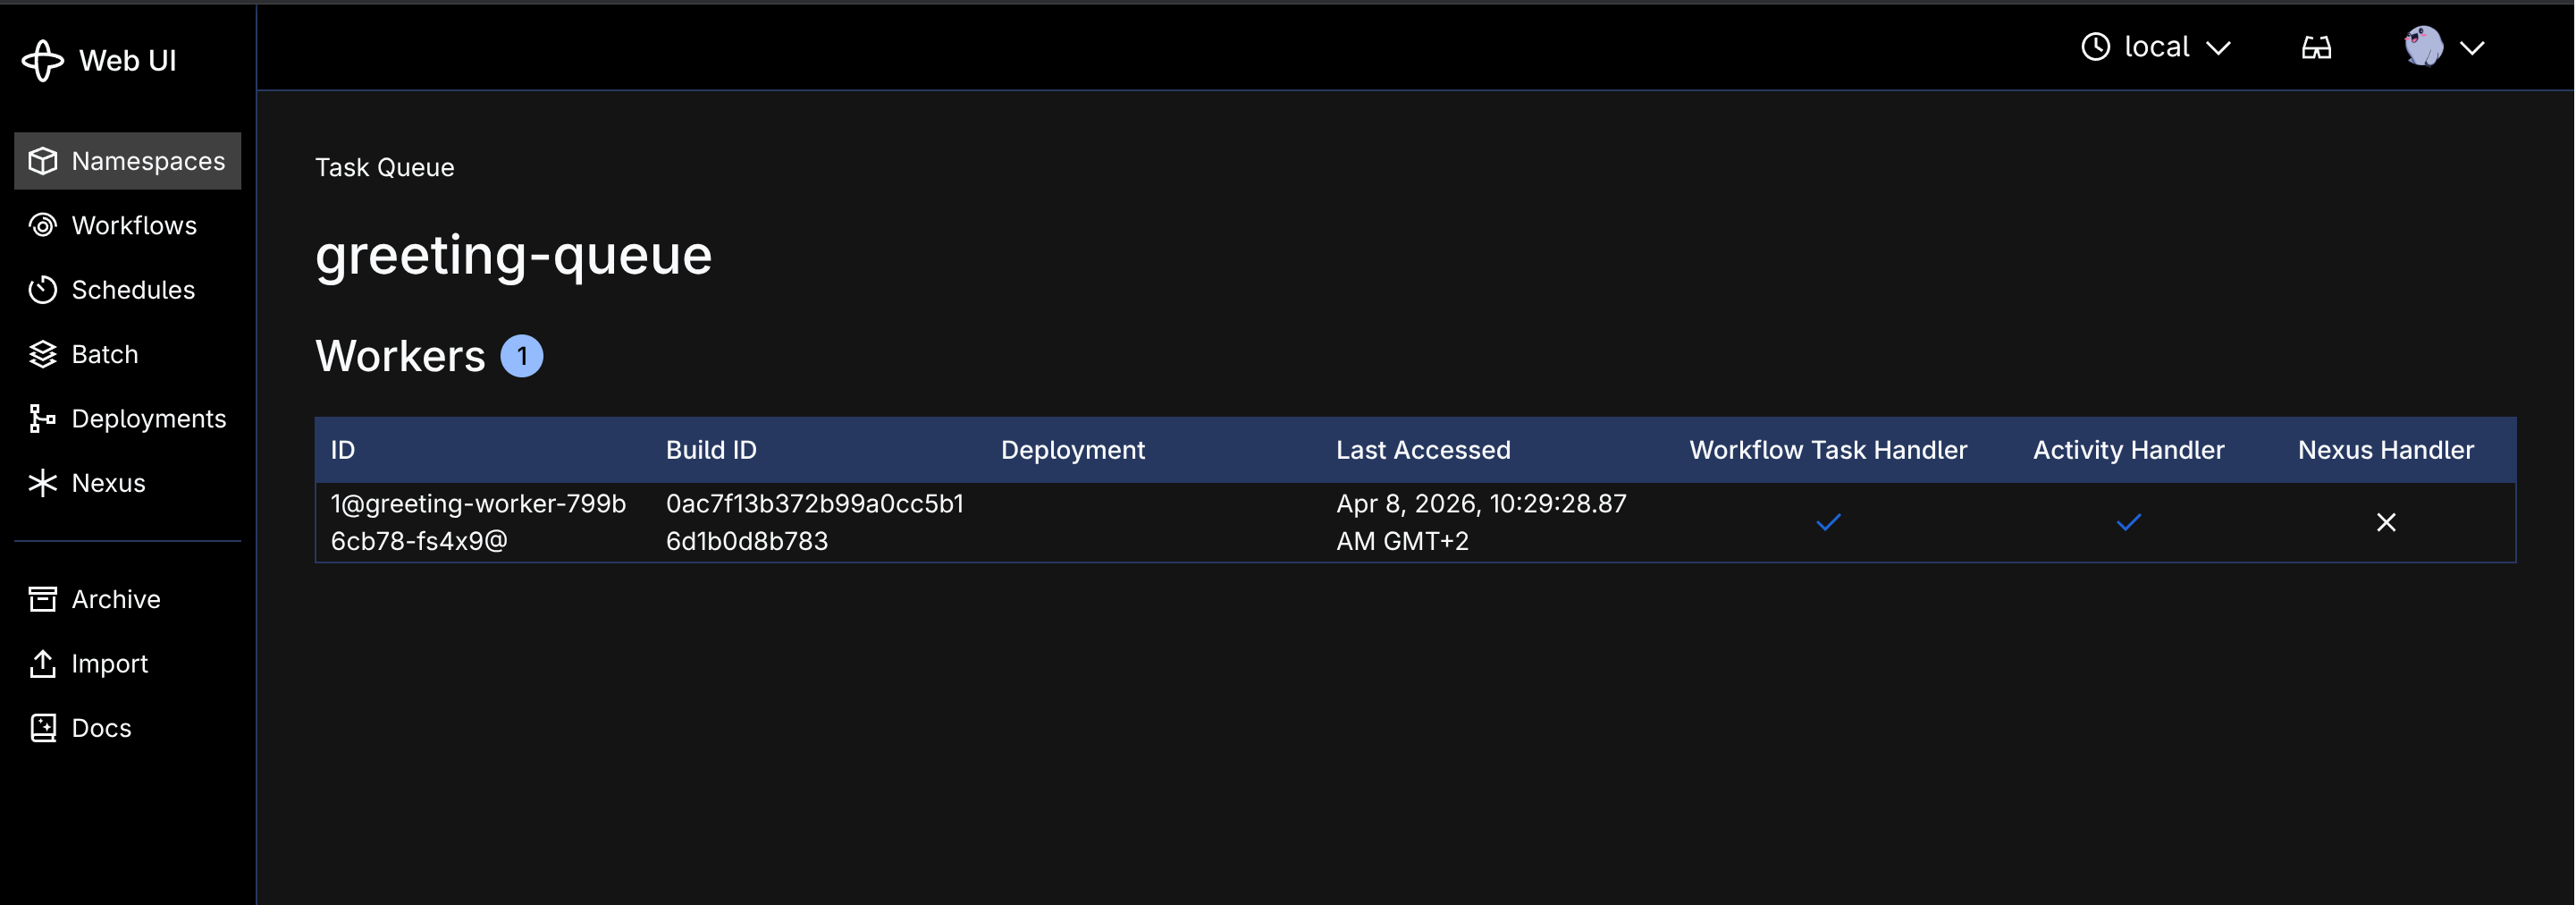
After a fresh rollout of the worker, the dashboard stopped updating. I went into the Temporal UI to see what was happening and started a workflow by hand to test the queue. It got scheduled and then sat there, never picked up by any worker, until the request timed out.
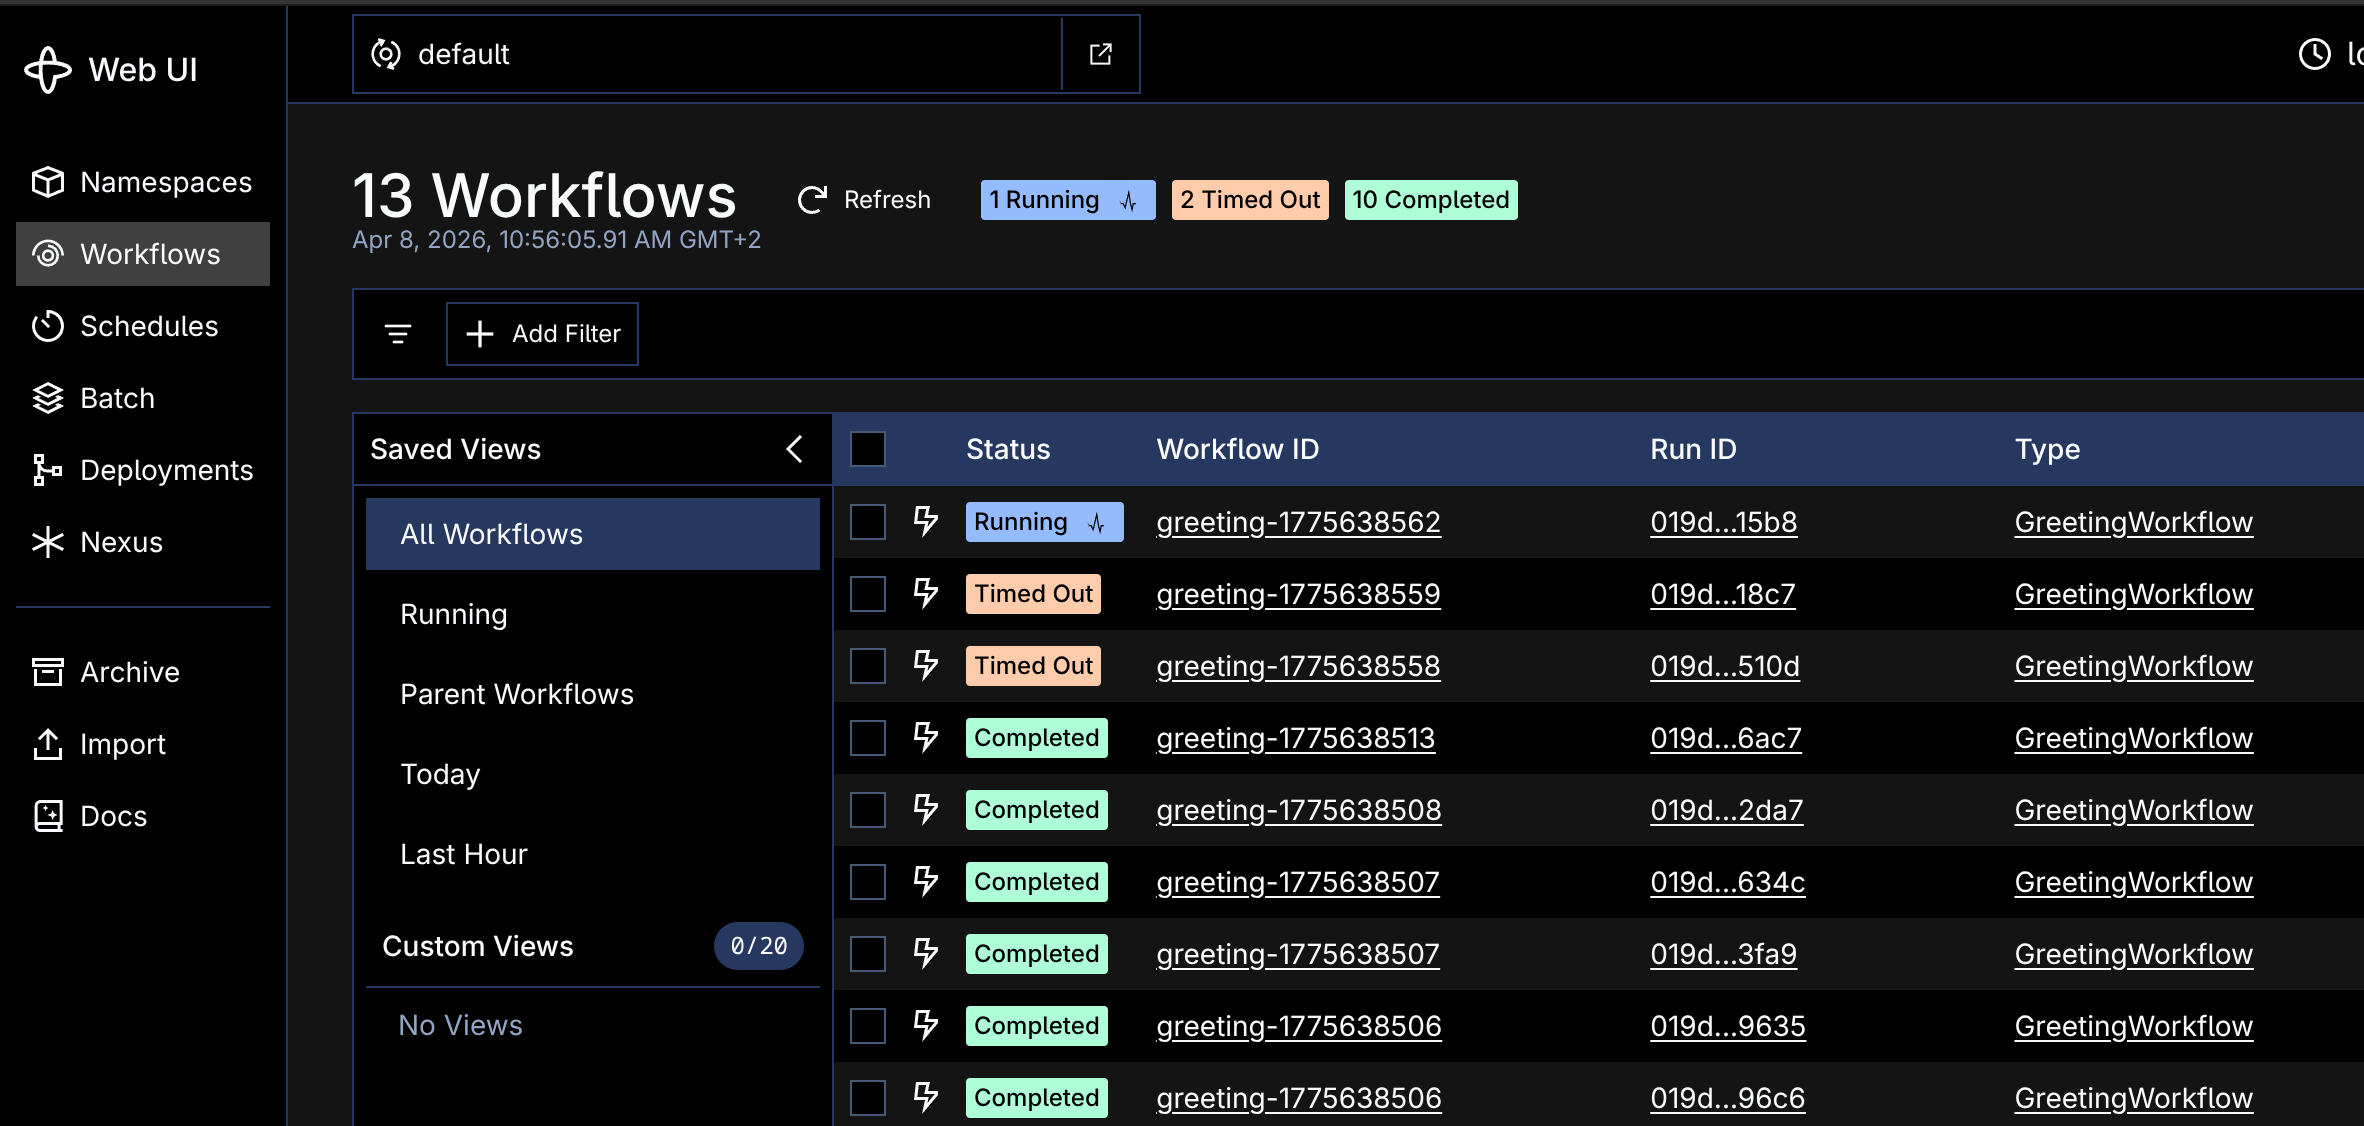
The task queue page still showed a poller. Per the Temporal task-queue docs, Temporal keeps reporting the last known worker for up to five minutes after it stops polling. Everything looked fine on the Temporal side, because the Temporal side was fine: the server scheduled the task and was patiently waiting for a worker to claim it.
That five-minute display delay is the trap. The natural place to start a Temporal incident is the Temporal UI, and the Temporal UI is going to spend five minutes lying to you about whether you have a worker.
How to find a CrashLoopBackOff worker with kubectl
After ruling out the obvious "is Temporal itself up" check, I switched to kubectl. The worker pod existed, but something was off:
$ kubectl get pods -n temporal -l app=greeting-worker
NAME                               READY   STATUS             RESTARTS      AGE
greeting-worker-5cd897fbcb-w5b58   0/1    CrashLoopBackOff   5 (30s ago)   3m
CrashLoopBackOff. The container was crashing on every start, and Kubernetes was patiently restarting it on a back-off schedule. As the Kubernetes debug docs describe, the kubelet uses an exponential delay between restarts: 10s, 20s, 40s, 80s, 160s, then capped at 300s. A pod stuck in this state goes several minutes between attempts and never stays up long enough to register on the Temporal task queue.
The logs revealed the cause:
$ kubectl logs -l app=greeting-worker -n temporal
2026/04/07 08:15:42 Simulated startup crash (CRASH_ON_START=true)
I had set CRASH_ON_START=true in the latest deployment manifest. The worker was crashing immediately on startup, before it could connect to Temporal, so it never registered as a poller. From the Temporal side, the task queue was simply empty.
The fix was trivial. Drop the bad env var and redeploy, and the worker came back online within seconds; workflows resumed and the dashboard caught up.
But the investigation still took about ten minutes. Open the Temporal UI, satisfy myself the server is fine, switch contexts to kubectl, find the right namespace, describe the pod, read the logs. The bad env var was a five-second fix surrounded by ten minutes of going between two systems that do not know about each other.
How an infrastructure context layer connects Temporal symptoms to the Kubernetes root cause
Most of those ten minutes were context-switching. I opened Temporal first because that's where the symptom was, ruled out a server issue, then opened a kubectl shell to find the crashing pod, then went back to Temporal once the worker came up to confirm the queue had cleared. None of those steps was hard. They just don't add up unless somebody is bridging them, which on every page is whoever is on-call.
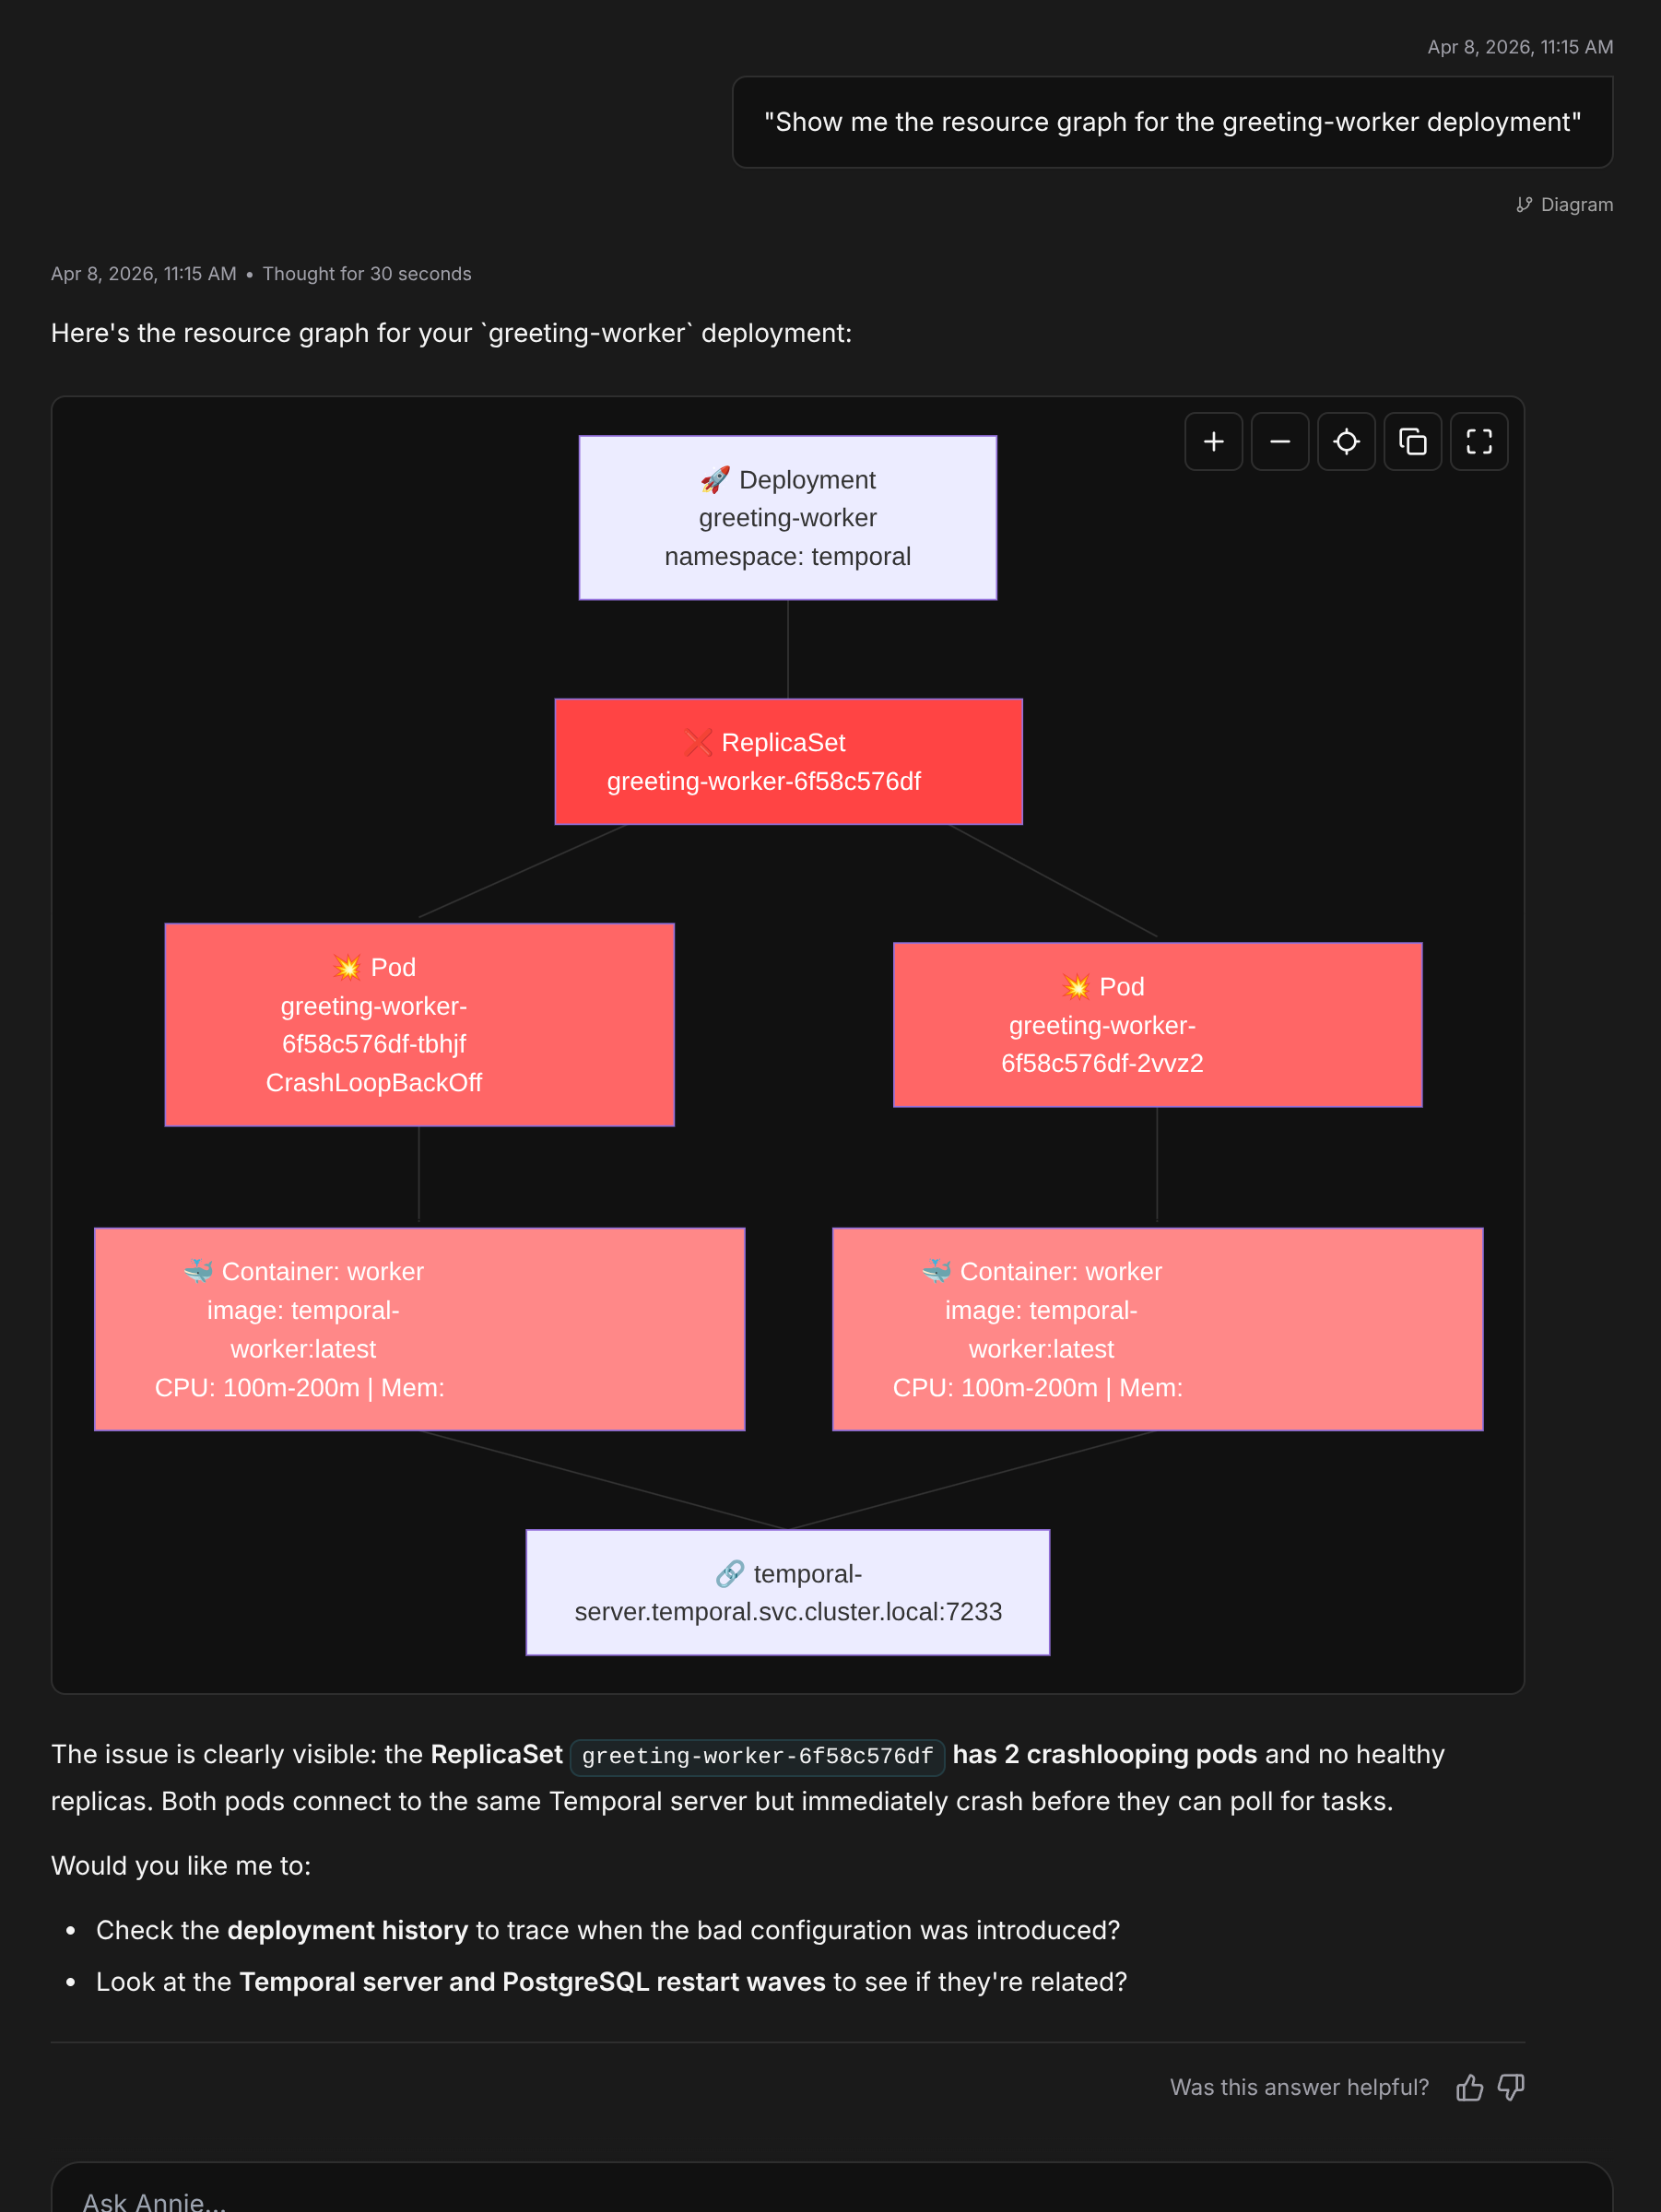
I rebuilt the same incident with Anyshift connected to the cluster. The graph already has Kubernetes pods, Temporal task queues, and the edges between the two (a greeting-worker pod registers on greeting-queue, that queue feeds a GreetingWorkflow). So instead of two consoles I had one prompt, into Annie, the agent that reasons over the graph:
"Why is my pipeline broken?"
Annie had been watching the Kubernetes cluster continuously, tracking pod states, events, restarts, and resource usage, and correlating what she saw with the rest of the infrastructure graph.
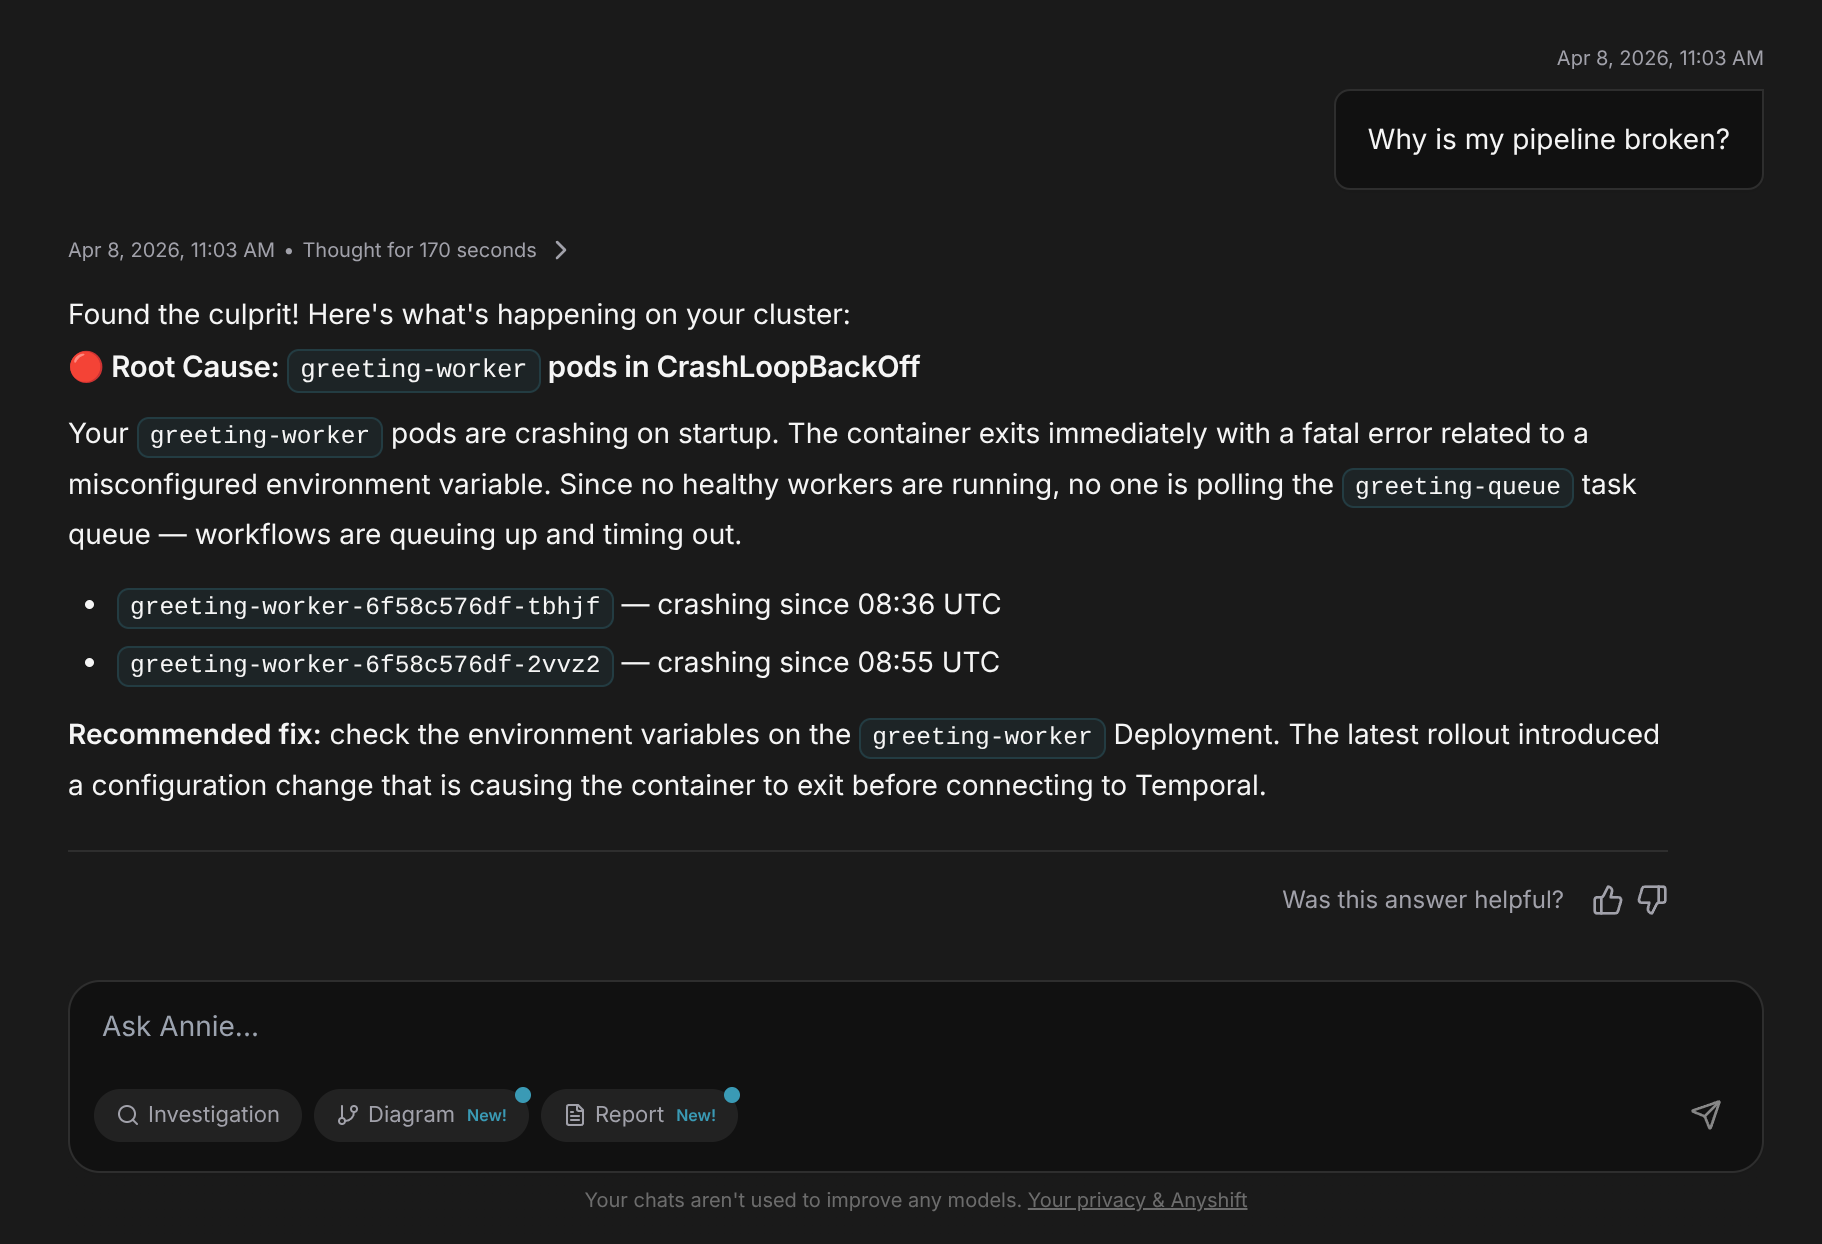
Within seconds she responded:
Root Cause:
greeting-workerpods in CrashLoopBackOffYour
greeting-workerpods are crashing on startup. The container exits immediately with a fatal error related to a misconfigured environment variable. Since no healthy workers are running, no one is polling thegreeting-queuetask queue, so workflows are queuing up and timing out.-
greeting-worker-6f58c576df-tbhjf: crashing since 08:36 UTC-
greeting-worker-6f58c576df-2vvz2: crashing since 08:55 UTCRecommended fix: check the environment variables on the
greeting-workerDeployment. The latest rollout introduced a configuration change that is causing the container to exit before connecting to Temporal.
One question, one answer. No tab-switching, no guessing which namespace to check, no scrolling through kubectl describe output for the relevant line. Annie had traced the symptom back from the stale dashboard through the timed-out workflows, through the empty task queue, all the way to the crashing pods.
The honest annoyance from my side, while building this walkthrough: Annie's first answer to "why is my pipeline broken" landed on the symptom (zero pollers) rather than the root cause (the crashing pod) on the demo cluster I was using before the graph picked up the cross-system edges. The graph needs the Kubernetes connector enabled and given a few minutes to sync before the K8s pod state is part of what Annie reasons over.
If you want the same bridge in place against your own Temporal + Kubernetes setup before the next real CrashLoopBackOff lands, the setup takes about thirty minutes against a read-only cluster credential. Get started with Anyshift.